

Welcome to BioMonitor4CAP
Who are we?
BioMonitor4CAP combines research and practice to further develop biodiversity monitoring in agricultural landscapes. The focus is on methods that enable biodiversity to be recorded in a standardised, comparable and efficient manner – from data collection in the field to analysis and interpretation.
To this end, we combine remote sensing (satellite and drone data), acoustic monitoring of farmland birds, and camera systems with automated image analysis for recording insects. In addition, eDNA methods are used to assess biodiversity and soil health via genetic traces from soil samples. In total, around 30 TB of data on agricultural biodiversity has been collected across Europe and organised in an online interface so that indicators can be visualised at plot level.
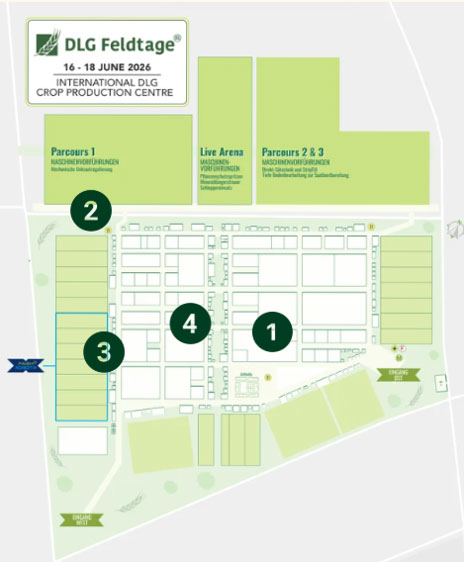
The stations on the site serve as demonstrations of these data collection and analysis approaches: on-site explanations cover which groups of organisms and indicators are being studied, which equipment and sampling methods are used, and the significance of the results.
You can find further information about our project here
We look forward to your visit!
WHY insects?
Insects react quickly to changes in land use and are therefore important indicators of biodiversity.
Beneficial insects such as wild bees, hoverflies and ladybirds aid pollination and natural pest control, whilst species such as aphids or certain beetles can act as pests.
A high diversity of insects indicates a stable, sustainably managed ecosystem.
However, the balance between species is crucial.
HOW is the data collected?
Modern, camera-based systems such as the Diopsis Scanner are used for data collection; these automatically photograph and classify insects. Additional camera systems record movements and activities without disturbing the animals. With the aid of artificial intelligence, the images captured can then be identified and analysed.
How much do you know about insects?
This quiz takes you through plant pests in an agricultural context and their natural antagonists.
Important to note: in nature, roles are rarely clear-cut. Many species that we are quick to label as ‘pests’ in horticulture or agriculture also fulfil important ecological functions – for example, as a food source, decomposers or as part of complex food webs. Whether a species is perceived as a problem depends heavily on where, when and in what density it occurs.
A stable, species-rich ecosystem supports this natural regulation.
Observing insects and reporting sightings yourself – an underappreciated contribution
Everyday observations help science: every sighting reported helps us to better understand the distribution and decline of individual species.
Here you’ll find suitable platforms and identification guides to get you started:
WHY birds?
Birds are highly sensitive to changes such as pesticide use, food availability or habitat loss.
At the same time, they perform important functions by regulating insect populations and dispersing seeds. High species diversity indicates a structurally rich and intact landscape, whilst declines in individual species can point to environmental problems.
Welcome to the birds station quiz!
This identification quiz is all about recognising birds by their calls. On this page, you’ll find an audio track featuring bird calls. In the quiz, you can then select which bird matches each call.
Take the quiz as an invitation to look and listen more closely on your next walk.
Citizen science as an extension of monitoring
Professional recording methods provide reliable data – their significance increases with the number of observations.
Anyone who systematically observes and reports on birds in their local area supplements scientific monitoring with valuable everyday data.
Here are some suitable platforms to get you started:
🔍 Report sightings in your browser
🔍 Report sightings via the app
📖 Merlin App identification guide
WHY SOIL?
Soil is the foundation of functioning ecosystems and productive agriculture. They are home to an enormous variety of organisms that convert nutrients, promote plant growth and stabilise soil structure.
The nematodes living in the soil serve as important indicators of the state of the soil food web.
WHAT is being measured?
Nematode-based indices serve as indicators of soil biodiversity. The composition and abundance of various nematode groups are recorded and compiled into metrics such as the Maturity Index (MI). This enables the early detection of soil quality, contamination and ecological processes.
HOW is it measured?
To do this, soil samples are taken, nematodes are extracted from them and then analysed. Antonie’s LIFE Monitor uses automated microscopy and artificial intelligence to count and identify organisms and calculate indices from them. In addition, eDNA (environmental DNA) can be analysed directly from the soil sample, providing further insights into biodiversity.
Soil harbours a hidden diversity – how familiar are you with the methods used to reveal it?
A handful of soil can contain thousands to millions of living organisms – from microorganisms to small soil animals. Many of these are invisible to the naked eye, but provide important clues as to how healthy and functional a soil is. In this quiz, you will match key terms relating to soil monitoring.
WHY landscape features?
Landscape structures such as hedges, field margins, water bodies and copses are crucial for a functioning ecosystem. They provide habitats, food and refuge for many animals and plants, and connect different habitats with one another. At the same time, they support important functions for agriculture, such as pollination, natural pest control, erosion protection and water retention. A structurally rich and well-connected landscape promotes biodiversity and ensures stable, sustainable ecosystems.
HOW is it measured?
Satellite imagery and drone flights are used for the analysis to record landscape structures over large areas. In addition, so-called landscape indices are determined, whereby the ecological potential of a landscape is described using a key figure. Various characteristics of a landscape influence biodiversity and are taken into account when calculating the index. These include, for example, area size, land use and habitat connectivity.
The landscape needs structure, both as a habitat and as the basis for productivity. Individual measures are often not enough. It is only when they work together that hedges, field margins and flower strips can have their full effect. Collaborative approaches help us to think of the landscape as a whole.
Further information can be found here:
ℹ️ KOMBI-Agrar
ℹ️ German Network for Rural Areas